ENVIRONMENTAL MICROBIOME INTELLIGENCE · SOIL
Context changes the conclusion
A reanalysis of published bacterial ASVs that makes the multivariate structure, the experimental unit and the limits of the evidence visible.
From 24 subsamples to eight units of analysis
We selected the 2022 baseline soil sampling: four sites, each with one cover-crop plot and one fallow plot. We summed the counts of the three subsamples from each plot. We analyzed 21,656 ASVs with non-zero counts; the multivariate visualizations use 854 genus-level groups after the declared filter.
Treating the 24 subsamples as independent replicates would overstate the evidence. The contrast rests on four pairs of plots and permutes within each site.
Open the scientific reportDownload ASVs and metadataVerify files and hashesIn this subset, cover cropping shows no conclusive evidence of an additional difference: partial RDA with p = 0.375 and an additional adjusted R² ≈ 0.006. Only 15 non-identical permutations are possible within the four pairs. We do not estimate crop yield, functional activity or a universal soil health score.
Verifying the explorer data…
Publication figures · SVG and PDF
01 · What structures the community?
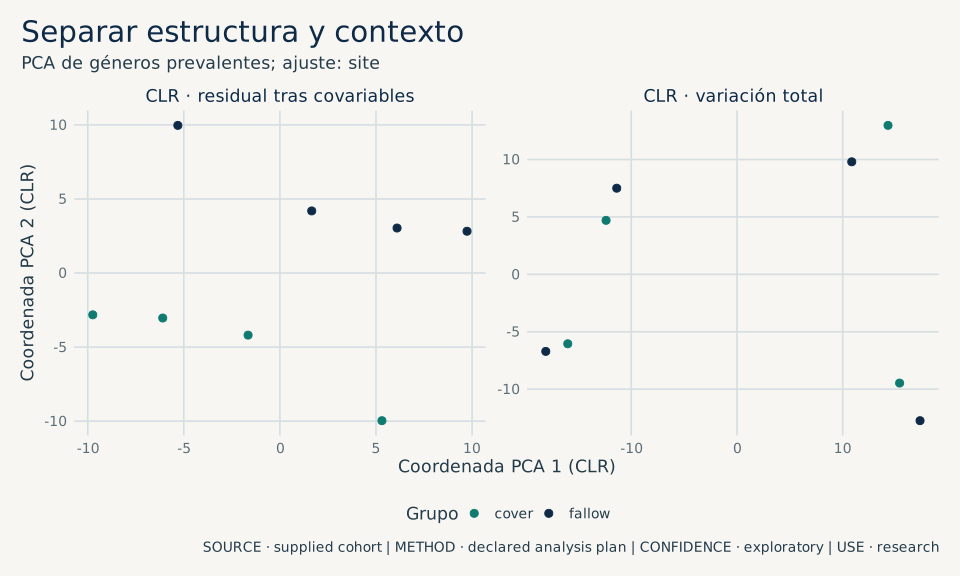
CLR ordination preserves the compositional geometry. The residual panel shows what remains after adjusting for site; its axes are not directly interchangeable with those of the original panel.
 Download the vector figure as PDF
02 · An atlas of variation, with no list of winners
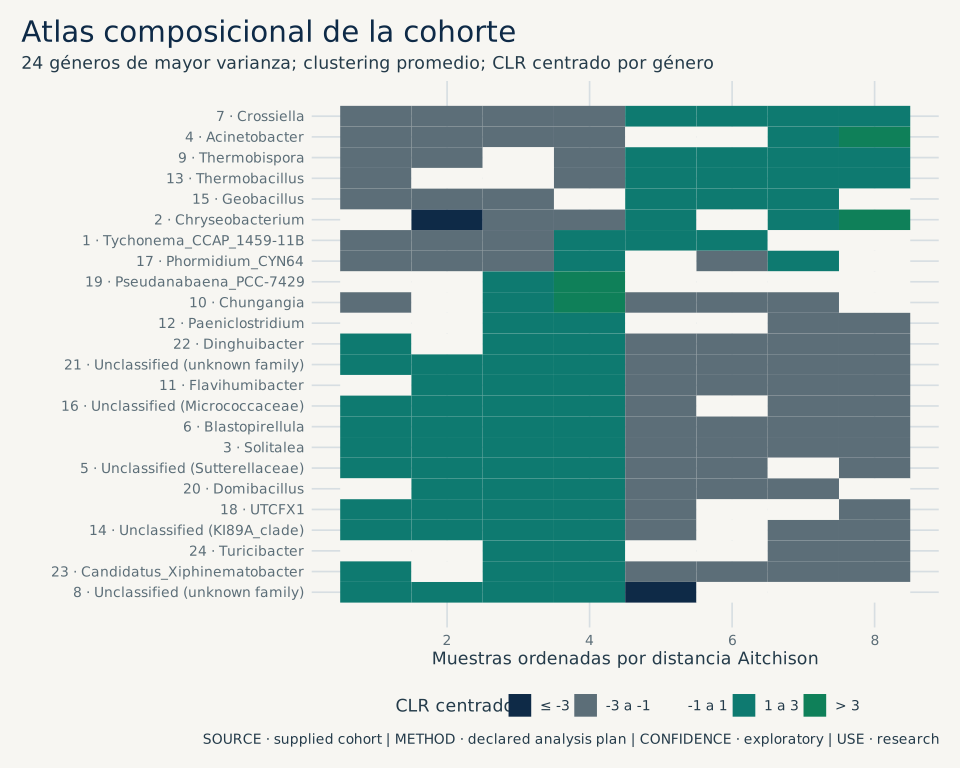
The 24 genera with the greatest variation are shown centered and clustered by similarity. Colors compare a single row across plots and do not represent absolute abundance between genera.
 Download the vector figure as PDF
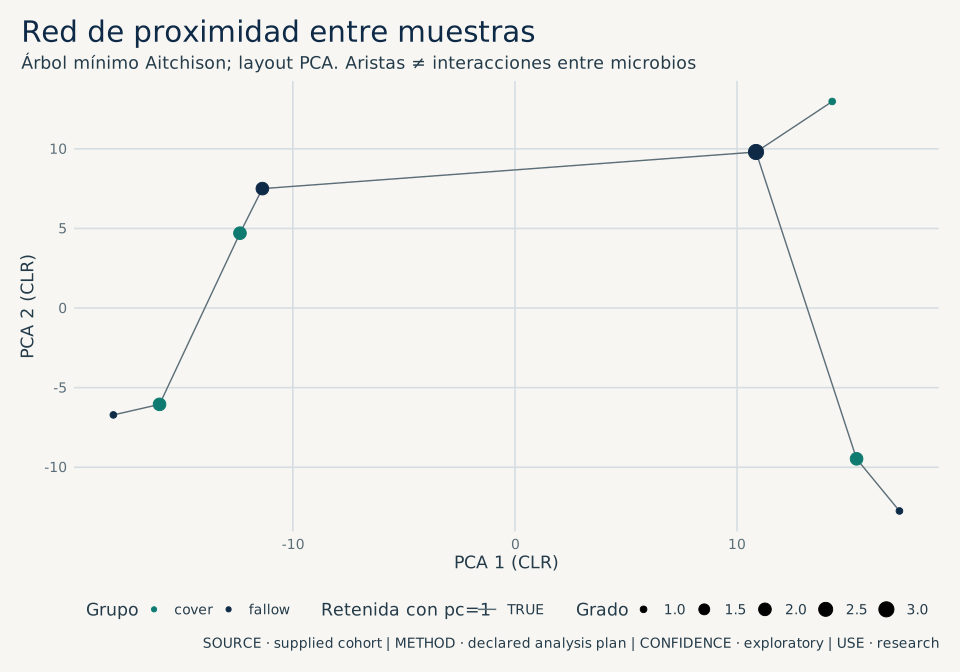
03 · Seven connections that summarize eight plots
The minimum spanning tree keeps only the connections needed to join all samples by Aitchison distance. It is a similarity network between plots, not a network of interactions between microorganisms.
 Download the vector figure as PDF
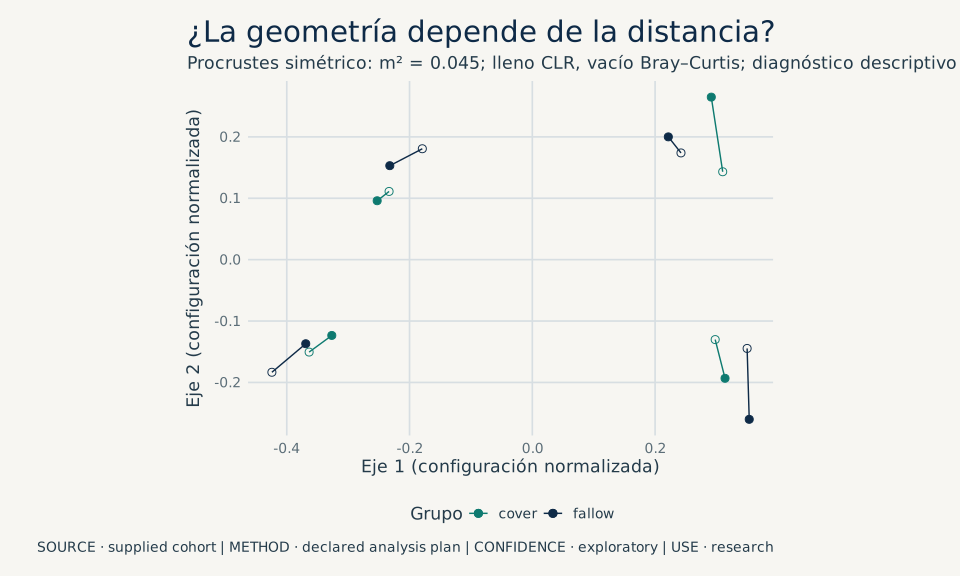
04 · Does the reading change with another distance?
The Procrustes superimposition contrasts two two-dimensional representations, CLR and Bray–Curtis. The segments help locate the discrepancies. The agreement is descriptive and partial.
 Download the vector figure as PDF
05 · Separate cover cropping from context
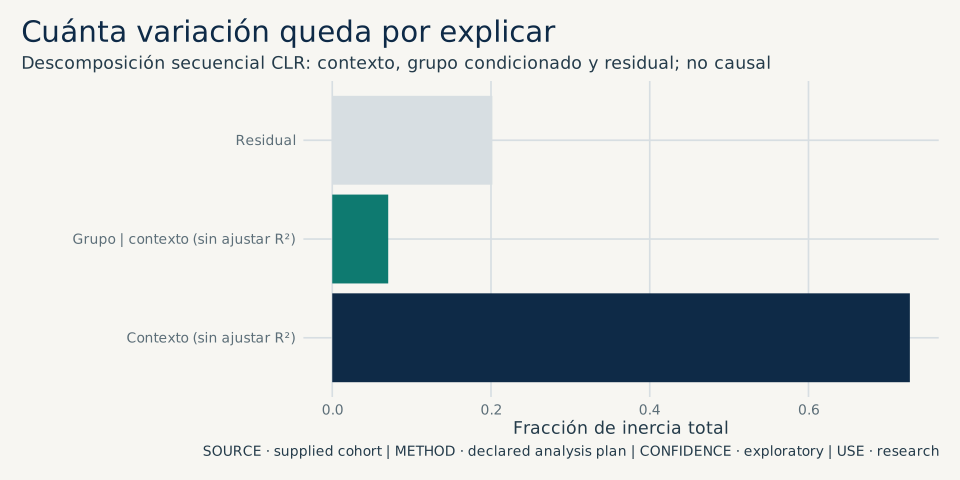
The partial RDA attributes 72.8% of the inertia to site, an additional 7.1% to cover cropping conditioned on site, and 20.2% to the residual. These are sequential unadjusted fractions, not causal contributions.
 Download the vector figure as PDF
Evidence you can inspect
The report was computed with R inside Docker and Snakemake. Coordinates, edges, atlas values and the decomposition are exported to TSV, and the methodological summary is delivered as JSON. It is a real precomputed run; the portal does not yet enable environmental uploads.
Inspect the JSON diagnosticsDownload the TSV edgesView provenance and transformationsOpen data, visible authors
Soheila Lahijanian, Jacob Schmidt, Ulf Feuerstein and Andrea Polle. Figshare dataset 28359911.v1, under the CC BY 4.0 licence. This is an independent reanalysis by Nexalel and implies no collaboration with or endorsement by the authors.
Transformations applied: selection of the 2022 baseline sampling, aggregation by plot, exclusion of ASVs with no counts in the subset and normalization of unresolved taxonomic labels. The original provenance is preserved.
Original dataset and licenceArticle and experimental designCC BY 4.0