MICROBIOME INTELLIGENCE · SYNTHETIC EXAMPLE
A signal deserves a second question
Finding differences is only the first step. Before proposing a hypothesis for review, you need to examine their magnitude, their stability and the limits of the design.
From file to reproducible dossier
This example contains 60 samples and 90 synthetic features. The engine runs a containerized Snakemake workflow and produces a report, vector figures and tables readable by people and by agents.
The report shown here is a frozen, verifiable run. From your workspace you can upload the same tables and launch a new job with real compute.
Sign in and run my analysisDownload the synthetic tablesOpen the full scientific reportSOURCE · nexalel-review-challenge.1729 · METHOD · R and Snakemake · CONFIDENCE · software validation · USE · synthetic demonstration
Verifying the explorer data…
Publication figures · SVG and PDF
01 · Separate structure from context
Compares the original CLR geometry with the residual geometry after adjustment. Visual separation does not resolve the confounding between batch and group.
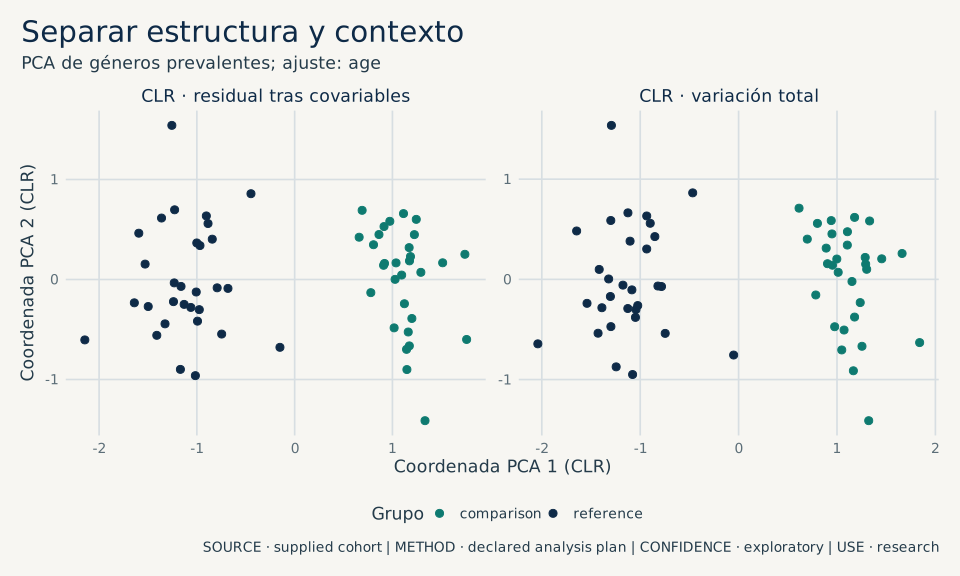
SOURCE · synthetic cohort .1729 · METHOD · descriptive compositional statistics · CONFIDENCE · computational test · USE · exploratory research
02 · Inspect the whole community
An atlas of the 24 genera with the highest variance, centered per genus and clustered by similarity. Selection does not depend on statistical significance.
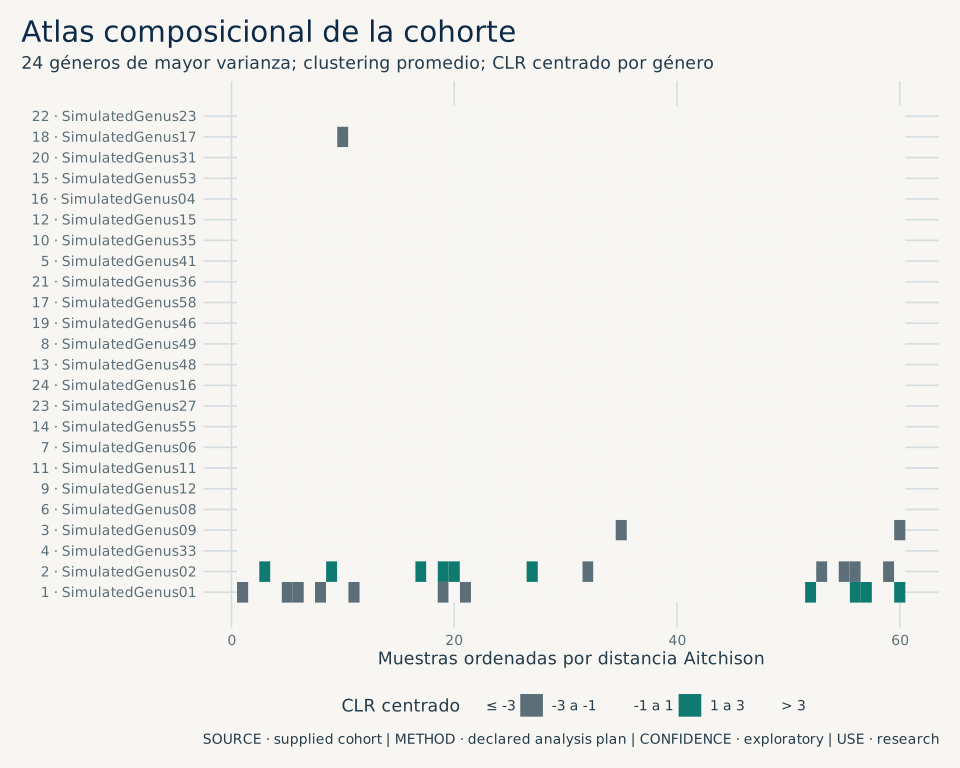
SOURCE · synthetic cohort .1729 · METHOD · descriptive compositional statistics · CONFIDENCE · computational test · USE · exploratory research
03 · Trace the relationships between samples
A minimum spanning tree connects samples by Aitchison distance. The edges describe similarity between samples and should not be read as microbial interactions.
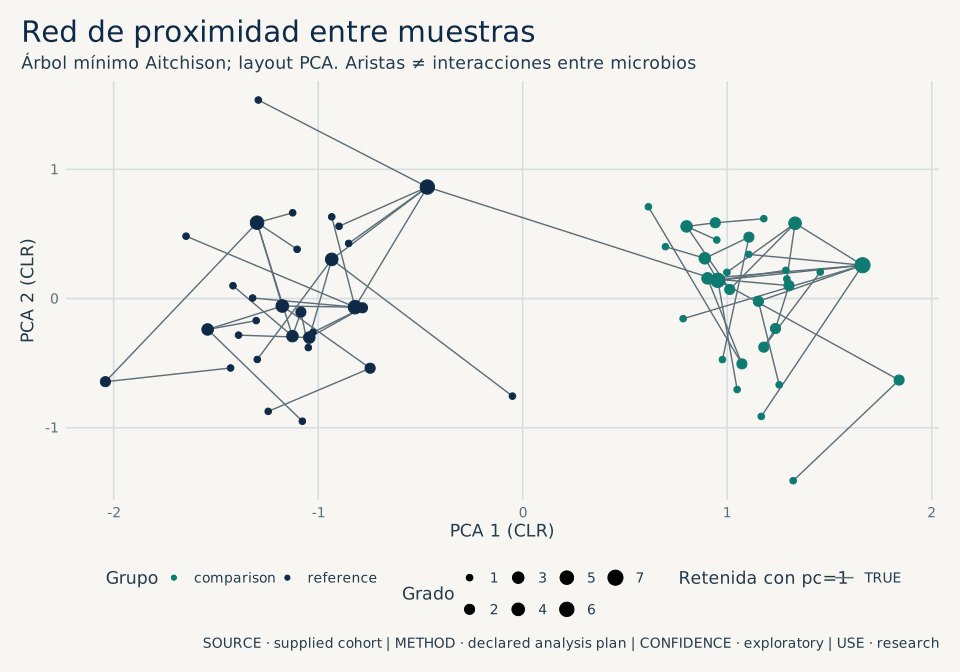
SOURCE · synthetic cohort .1729 · METHOD · descriptive compositional statistics · CONFIDENCE · computational test · USE · exploratory research
04 · Contrast two geometries
Procrustes compares the CLR representation with Bray–Curtis. The segments show where the two representations disagree; they do not prove that they are equivalent.
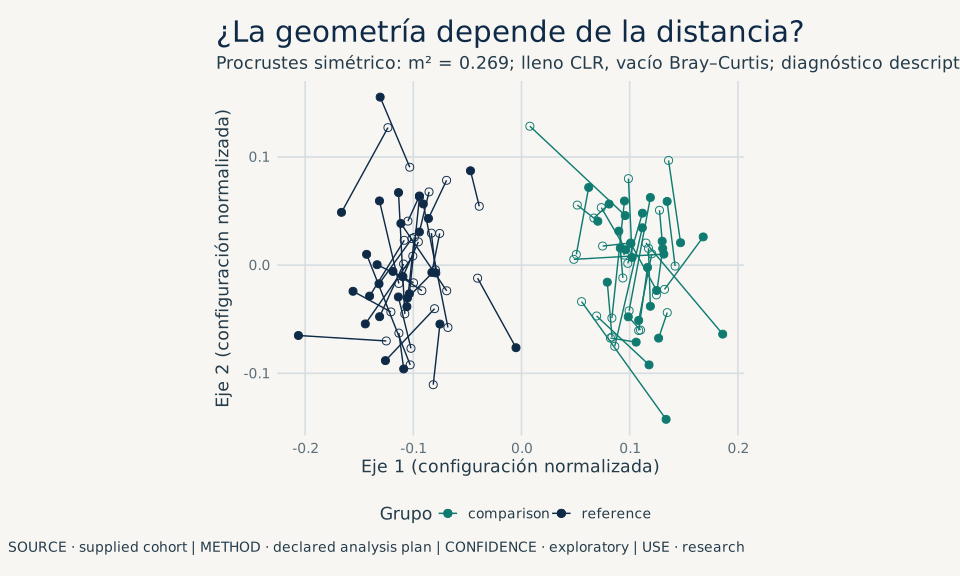
SOURCE · synthetic cohort .1729 · METHOD · descriptive compositional statistics · CONFIDENCE · computational test · USE · exploratory research
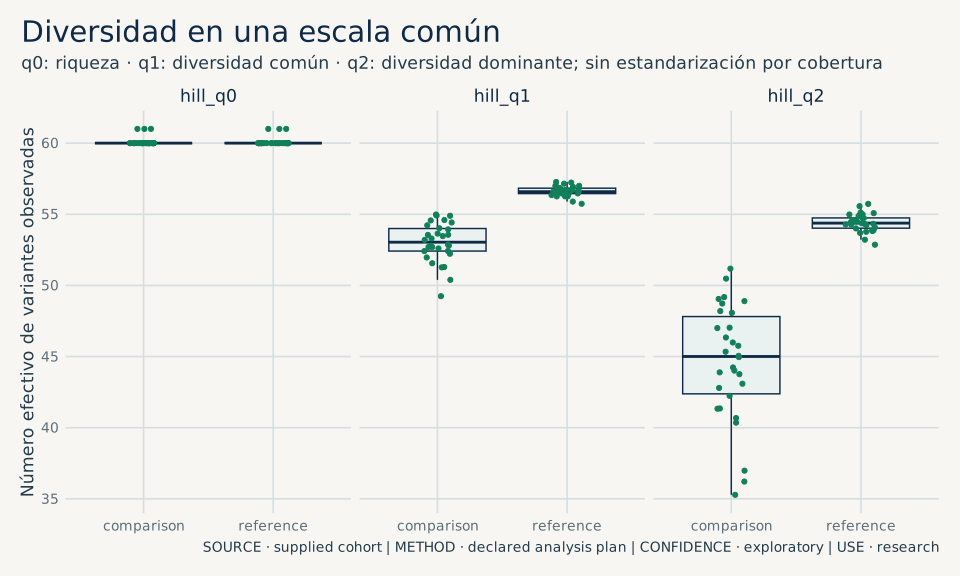
01 · See the community at several scales
Observed richness and Hill numbers distinguish presence, evenness and dominance. They describe this cohort and follow no universal scale of health.
SOURCE · synthetic cohort .1729 · METHOD · descriptive compositional statistics · CONFIDENCE · computational test · USE · exploratory research
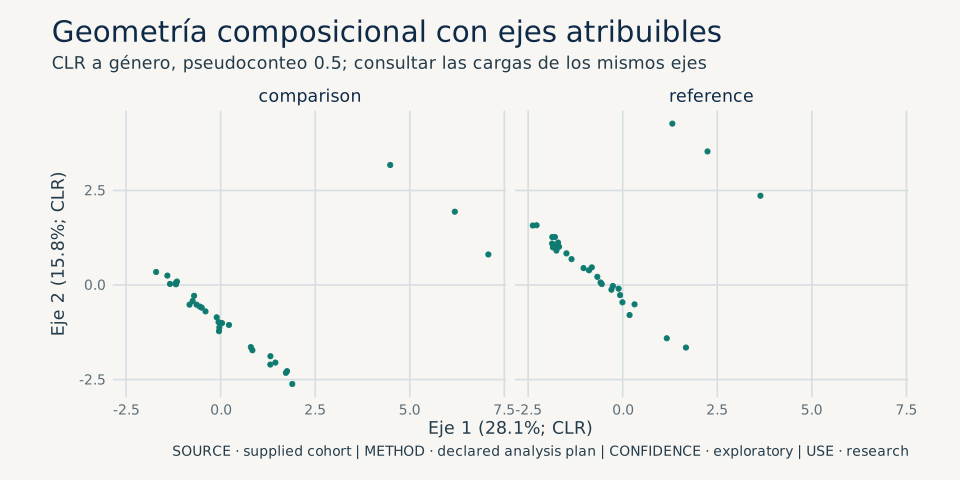
02 · Understand what separates the samples
Compositional ordination summarizes the differences. The contribution of each genus lets you inspect what structures the axes, without turning separation into causation.
SOURCE · synthetic cohort .1729 · METHOD · descriptive compositional statistics · CONFIDENCE · computational test · USE · exploratory research
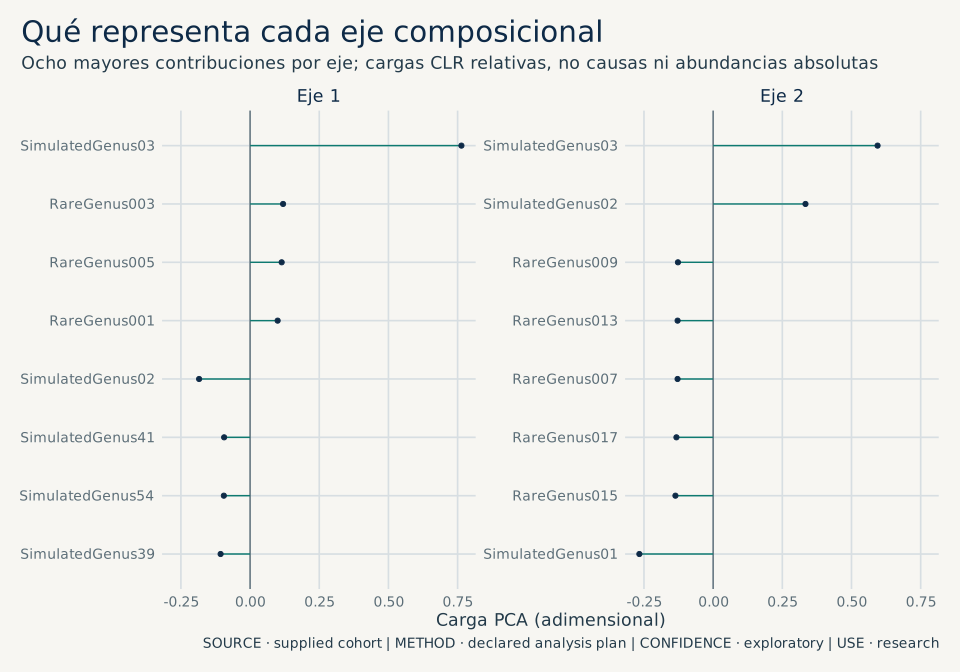
03 · Make the drivers visible
Every contribution can be traced back to an exportable table. The sign of an axis is a convention, and loadings are not clinical effects.
SOURCE · synthetic cohort .1729 · METHOD · descriptive compositional statistics · CONFIDENCE · computational test · USE · exploratory research
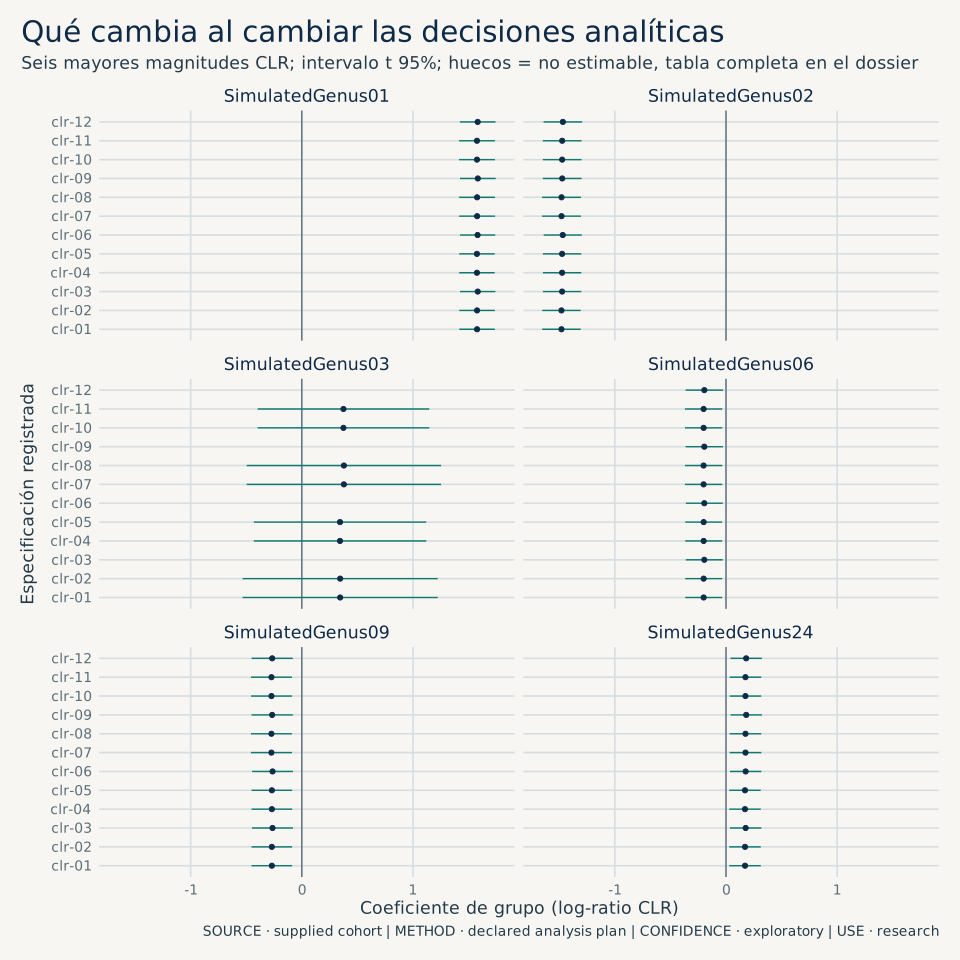
04 · Ask how much the signal depends on the method
Twelve predefined specifications vary prevalence, pseudocount and age adjustment. A rare taxon is eligible in only eight of them, and both the denominator and the non-estimable results remain visible.
SOURCE · synthetic cohort .1729 · METHOD · OLS CLR; BH per specification · CONFIDENCE · computational test · USE · exploratory research
The example introduces complete confounding between batch and group. Without negative controls, contamination cannot be assessed. Stability across specifications is not the same as replication and does not demonstrate clinical validity.
The evidence continues beyond the chart
Private outputs include TSV, JSON, JSONL, provenance and hashes, in addition to SVG, PDF and PNG. Each user views their jobs and downloads results from their own workspace.
Inspect the JSON dossierDownload the TSV specificationsView provenance and hashesThe current portal accepts count tables. 16S FASTQ input is tested in the container, and FASTQ upload from the web is not yet offered. Pilot results expire after seven days.